In this activity students will be comparing noise levels in different areas of the school and recording the data in a table format. Students will also be required to make simple predictions and evaluate them.
Aims
Make simple but informed predictions on noise level at different locations within the school.
Evaluate predictions and discuss why they were correct or incorrect.
Download the Code
MakeCode Editor
Download the MakeCode editor code for this lesson. The hex file is contained in a zip folder.
Refer to our download the code page for instructions on how to upload your code onto the micro:bit. Please use instructions set A.
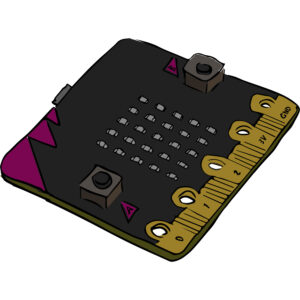
Connect the micro:bit to the Mini Innovation board via the edge connector.
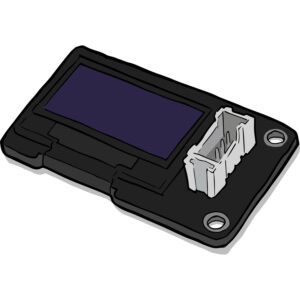
Use one of the connector cables to connect the OLED display to the I2C connector on the Mini Innovation board.
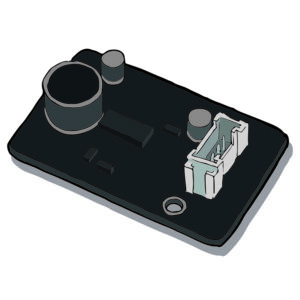
Connect the sound sensor to the ADC1 connector on the Mini Innovation board using the other connector cable.
Connect the micro:bit to a computer via the microUSB cable.
Download the code for this investigation and upload it onto the micro:bit. Go to the top of this page for more details. Once the code is downloaded unplug the micro:bit from the computer and connect the external battery pack. The students should test their devices to check the code has uploaded onto the micro:bit correctly. When button A is pressed on the micro:bit a number will display on the OLED display. This number displayed represents a percentage reading. Any value lower than 10% will be displayed as <10 and any value higher than 90% will be displayed as >90. The value will display for 5 seconds and then the display will clear and button A needs to be pressed again.
Activity
Students should work in groups of two and discuss five locations to measure the sound level. These locations can vary between indoor and outdoor areas. The students should record the location names onto the worksheet provided.
Once the locations have been chosen the students should make predictions as to which locations will be louder or quieter. Students can record their predictions in the worksheet provided by ranking the locations 1 – 5. 5 being the loudest.
Next the groups need to visit their first location. When they arrive at their location they should write a description of the surroundings. For example, the location chosen might be the school gate. This may mean there are multiple vehicles near by. The students should record this information.
Once the description of the surroundings has been recorded the students should take some sound readings. Remember, press button A to display the percentage value on the OLED display. This value will clear after 5 seconds. It is advisable to take 3 readings at each location and work out the mean value. This will result in a more accurate representation of the data. The mean value can be calculated by adding the 3 readings together and dividing by 3. Record the mean value into the worksheet provided.
The groups should then complete the last 2 steps at the remaining 4 locations chosen.
Finally each group should evaluate their results to see if their predictions were correct. The students can discuss possible reasons for any incorrect predictions and share with other groups.